Understanding the Market with Micro Voodoo Lines Indicator: An Introduction for Traders

David Starr
6 min read
Understanding the Market with Micro Voodoo Lines Indicator: An Introduction for Traders
- I. Introduction: Overview of the Micro Voodoo Lines Indicator
- II. The Challenge of Trading in a Market with No Memory (trend)
- III. Understanding Market Movement with Micro Voodoo Lines
- IV. Objectivity of Micro Voodoo Lines versus Elliott Wave Analysis
- V. Benefits of Using Micro Voodoo Lines
- VI. Illustrating Micro Voodoo Lines in Practice
- VII. Why Are The Micro Voodoo Lines So Effective?
- VIII. Conclusion: Micro Voodoo Lines as a Valuable Tool for Traders
Introduction: Overview of the Micro Voodoo Lines Indicator
As an options trader, finding the right levels of support and resistance on smaller time frames can be a challenge. The new Micro Voodoo Lines Indicator can help. Unlike the classic voodoo lines indicator, which is used on longer time frames, the Micro Voodoo Lines Indicator is designed to find smaller, intraday levels of support and resistance. This provides a detailed view of the market’s movement from level to level and allows traders to take advantage of smaller intraday moves using areas of support and resistance.
The Challenge of Trading in a Market with No Memory
David Starr, a respected trading expert, recently discussed the challenges of trading in a market with no memory from day to day. Even in trending markets, there is uncertainty and volatility. However, the key to successful trading in this market is to know the levels that the market is reaching when it makes its wild moves.
This is where the Micro Voodoo Lines come in.
Similar to classic voodoo lines, the Micro Voodoo Lines provide a way to understand the market’s movement from level to level systematically. The red firelines are the most important levels, followed by the green treelines and then the white snow lines. While the Micro Voodoo Lines don’t necessarily predict what will happen at each level, they provide a starting point for making sense of the market.
Objectivity of Micro Voodoo Lines versus Elliott Wave Analysis
Starr acknowledges that Elliott Wave analysis can be helpful in understanding market moves, but it can also be problematic if there are too many conflicting opinions on what the wave scenario is. Micro Voodoo Lines provide a more objective way of describing market moves and extracting information from wave scenarios.
Starr admits that he had been hoarding the Micro Voodoo Lines for years but has finally agreed to turn them into an indicator so that others can benefit from them. The Micro Voodoo Lines are especially important in the current market environment, where there is a lot of uncertainty and volatility.
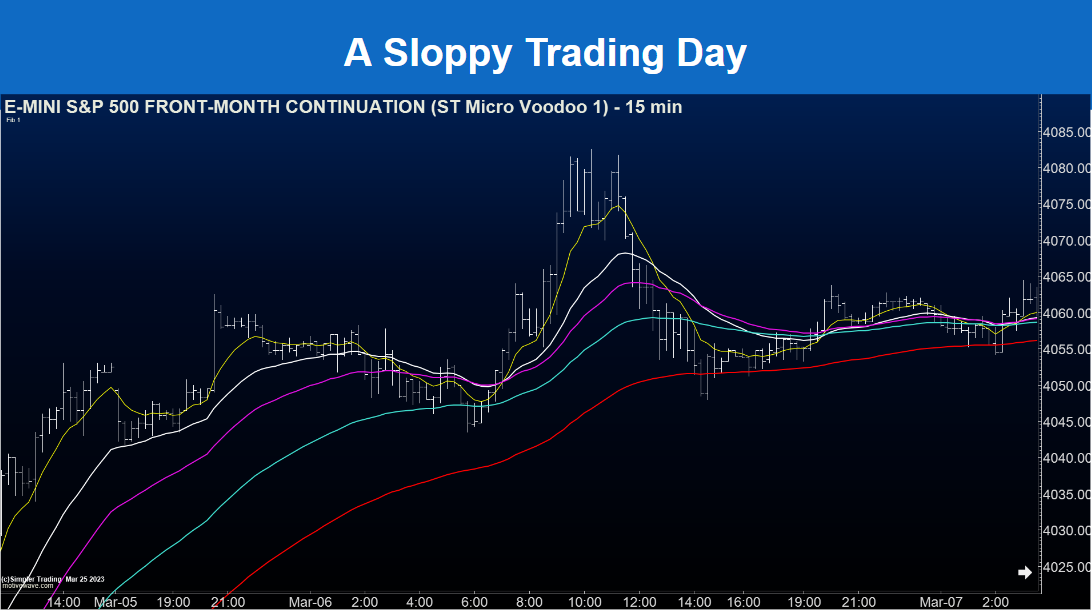
Illustrating Micro Voodoo Lines in Practice
To illustrate how the Micro Voodoo Lines work in practice, Starr shows a chart of today’s market action. In contrasting charts, the Micro Voodoo Lines show a stark difference between having no reference point for price action and a detailed map of price action.

The Micro Voodoo Lines offer a systematic way of understanding market moves and should be a valuable tool for traders in the current market environment. They provide a starting point for traders to make sense of the price action and understand what’s going on in the market. While the market may be filled with uncertainty, the Micro Voodoo Lines can provide traders with a sense of direction and help them make informed decisions.
Why Are The Micro Voodoo Lines So Effective?
Unlike traditional Voodoo Lines, which are generated based on confirmed wave five tops and bottoms, Micro Voodoo Lines are generated based on shorter-term price movements. This allows for a more detailed view of areas of support and resistance in the market.
The current market is experiencing a lot of violent chops, back and forth, between key psychological levels. Between these major levels, there are often huge voids, sometimes 50 to 100 points wide. This can be frustrating, especially for traders who are looking for short-term intraday moves.
The Micro Voodoo Lines offer a detailed map, allowing traders to find intraday levels of support and resistance based on short-term price action. The real benefit is that traders can identify potential intraday trades with precision and move quickly in and out of trades. This can be valuable in times where the market has more chop than trend.
Conclusion: Micro Voodoo Lines as a Valuable Tool for Traders
In conclusion, the Micro Voodoo Lines Indicator is a powerful tool that traders can use to navigate the current market conditions. They offer a starting point for traders to make sense of the price action and understand what’s going on in the market. While the market may be filled with uncertainty, the Micro Voodoo Lines can provide traders with a sense of direction and help them make informed decisions. As a trusted source of information and advice for traders

FAQ:
Q: What are the Micro Voodoo Lines?
A: The Micro Voodoo Lines is an indicator used by options traders to find smaller, intraday levels of support and resistance on smaller time frames. They offer a detailed view of the market’s movement from level to level and allow traders to take advantage of smaller intraday moves using areas of support and resistance.
Q: How do the Micro Voodoo Lines work?
A: Similar to classic voodoo lines, the Micro Voodoo Lines provide a way to understand the market’s movement from level to level systematically. They offer a starting point for making sense of the market, but they do not necessarily predict what will happen at each level.
Q: What are the benefits of using the Micro Voodoo Lines Indicator?
A: The Micro Voodoo Lines Indicator provides a systematic way of understanding market moves and helps traders make informed decisions. It also offers a more detailed view of the market compared to classic Voodoo Lines.
Q: Why are the Micro Voodoo Lines effective in trading?
A: The Micro Voodoo Lines are effective because they help traders understand the persistent trends and pullback opportunities. They also provide a more detailed view of the market and a sense of direction for traders.